Fall 2021 Charleston Real Estate Market Update

In this edition of our 2021 Fall Charleston Market Update, we will be looking at national and local historical data. This will help us understand as to what we can expect from the current trends. Which consequentially will help us to make better choices in the future.
What You’ll Discover in This Fall Charleston Market Update
- We are on pace for this to the 5th best year on record at a national level.
- Home Prices are back up to the old trend line!
- Waiting for more homes to hit the market may not be the best strategy!
- Mortgage Rates – Still very, very low…for now!
- Unemployment & Consumer Confidence – The good, bad and the ugly!
- Inflation – The Dragon that needs to be slain.
- The gap between wages and home prices has never been wider!
- Will Mortgage Forbearance impact our market?
- How is the Remote Worker affecting the market?
- Why “this time, is not like last time”!
Data Sources & Charts Used in The Fall Charleston Market Update
Most of the data, charts and graphs that follow are from Gary Keller’s recent 2021 Market Update presented at the Keller Williams Realty International Convention in August.
One of the brightest minds in real estate today, Gary Keller is known for his accurate market forecasts and vast knowledge of how current economic activity affects the real estate market.
Fall Charleston Market Update – Sales and Prices
National Home Sales
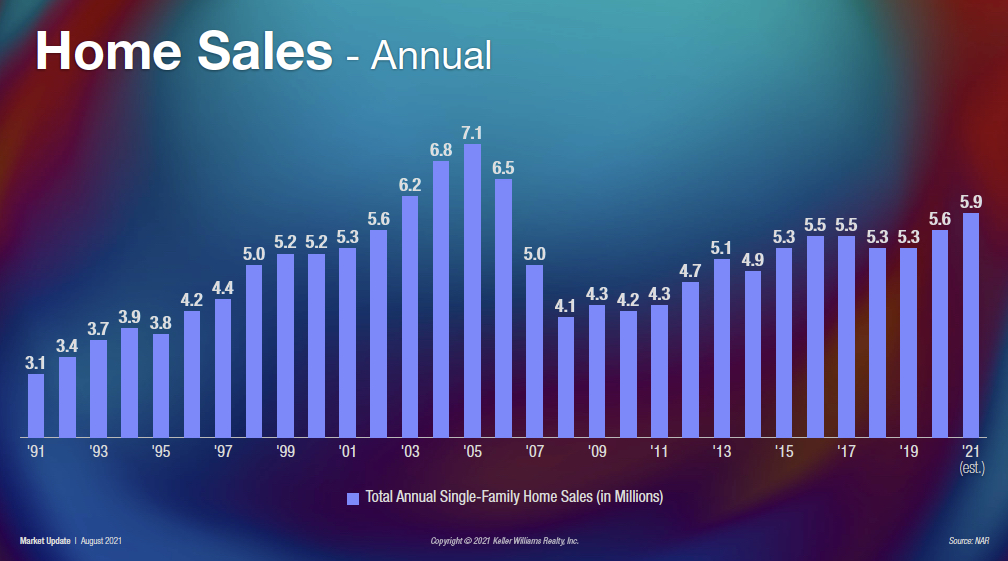
Let’s jump right into our Fall Charleston Market Update and look at National Home Sales.
First, notice that we are on pace for the 5th best year for real estate sales ever! Who would have expected this at the beginning of the pandemic!
Moving forward, most experts agree that we will not be falling off a cliff as we did in 2006. Many believe we will have a flattening of the market. This be caused by more homes coming on the market and demand slowing somewhat.
Local Sales
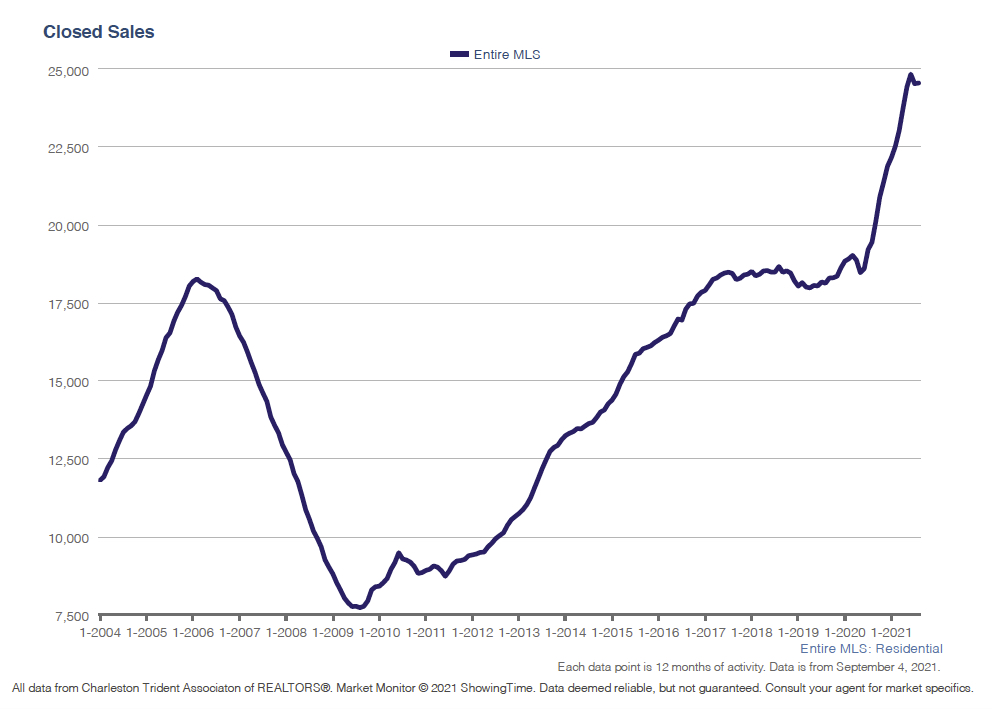
Looking at Local Sales, you can see in our Fall Charleston Market Update, home sales have been a little more aggressive to the upside in our area than the national numbers. In my opinion, this is due to the recent migration of folks leaving the colder climates and dense cities.
Seasonally, we typically see a slowdown in the fall through to Christmas. However, right now the demand for homes is still high and inventory still selling fast. Which may keep the market from slowing down this year. However, when I talk with other folks in our local industry, some say they are feeling things slow down somewhat. Which is something we will have to keep an eye on this as we move forward.
One of the Most Important Charts

The yellow line represents the Long-Term Average of Home Price Appreciation. As you can see, we are now back above that trend line. After the housing crash, Gary Keller explained to us that many felt that this trend line was reset down 16%. Consequently, when we look at the homes prices on the chart for 2021, we see that prices are now back above this trend line. So what does this mean?
To this point we had 7 years above the trend line during the housing bubble from 01-08. What this means is, we could very well see prices remain above this trend line for a few years. It’s something to watch.
Local Home Prices

The above chart shows the increase of local home prices. Be aware that this chart is somewhat condensed from left to right. Which makes the upward sloop look a little more extreme! However, it also reflects the greater demand for homes in our area than other parts of the country.
“If you are unaware of what’s happening right now in our local real estate market, let’s talk about the kind of wealth you’ve built in your home. This is a unique time in our real estate history.” G. Keller
Time Heals All!
“I’m just going to wait for the market to come down.”
At this point, every homeowner in Charleston should not be underwater! Even if you bought a home at the highest point of the previous housing bubble in 2006! The lesson here is that you can buy a home at the worst time possible and eventually be ok!
Since most people live in their homes for 7-10 years before they move again, time will correct any timing issues. Also, with the low interest rates making the cost of owning lower there is an offset there too.
It’s Always a Great Time To Buy A Home!
So, if you are planning on living in the home you purchase for a long time, and you have other good reasons for wanting to own a home, then go ahead and buy one! Staying in a home for a long time with these low rates, is a great combination. Focusing on the short term may keep you from experiencing all the benefits of owning a home today! Plus, prices may keep climbing and interest rates will eventually rise!
Fall Charleston Market Update – Housing Supply
National Home Supply

The lack of inventory on the market should not be a surprise to most people at this point. Again, based on the number of actual sales, it has not a shortage of homes, it’s been a massive increase in demand.
Local Home Supply
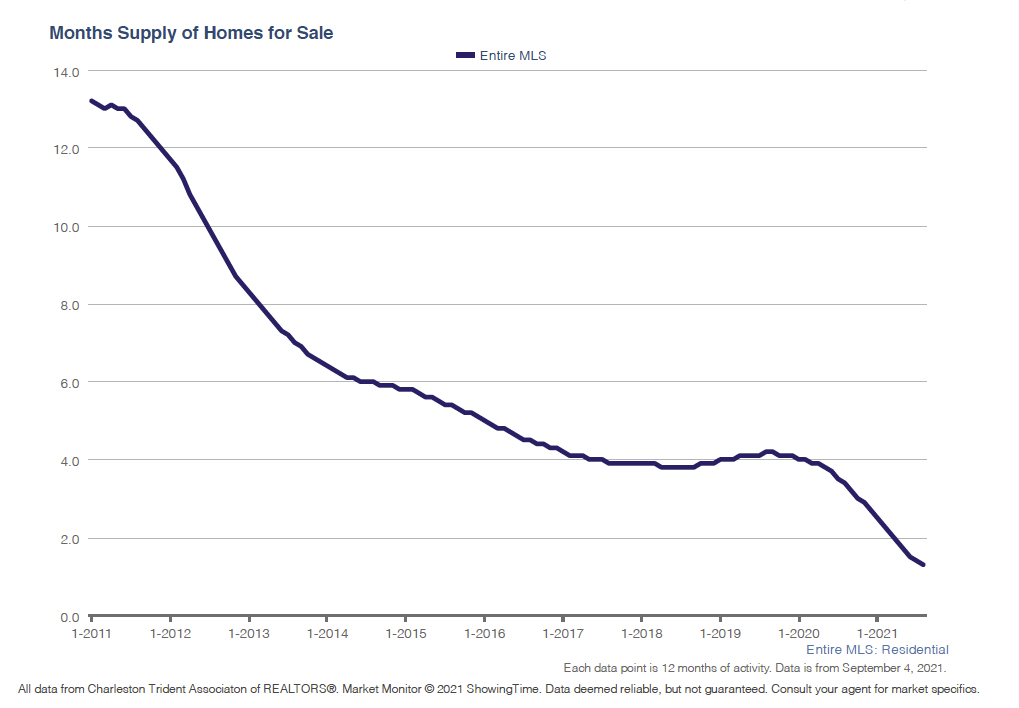
Historically we have never seen homes selling so fast in our market!
Number Of New Listings Nationally – Trending on Average!

This chart is a little different. This shows the seasonality of new listings coming on the market. Each line represents a different year, except the blue line which represents 5 years combined.
You’ll notice these lines are very similar except during the spring of 2020. This was when the country was locked down. So again, this chart confirms that the massive increase in demand. We don’t have a housing shortage; homes are simply selling very fast!
Seasonality Of When New Listings Locally Come On The Market
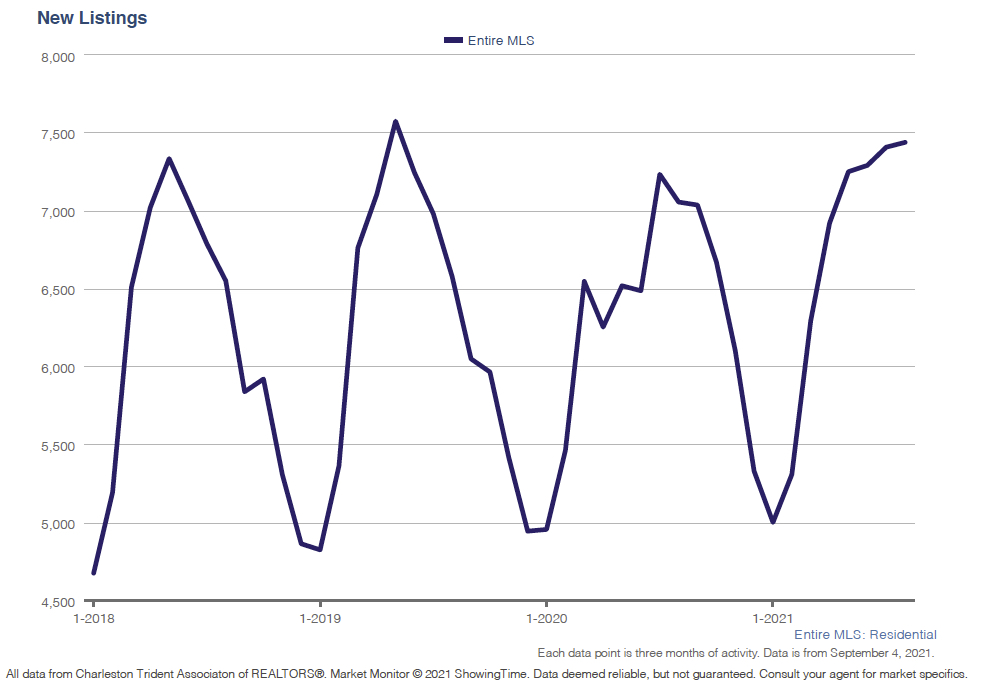
Here our local chart shows the seasonality of when homes come on the market each year. This chart doesn’t actually show the months on it but it’s the same every year. New lisitngs start coming on the market in January to July and fewer homes are listed between July and December.
Most of the population believes that the best time to sell or buy a home is in the spring. For a variety of reasons, for many people it is. However, for many other reasons, selling or buying a home in the fall and winter, might be just as good? If not a better time!
Fall Charleston Market Update – The Economy
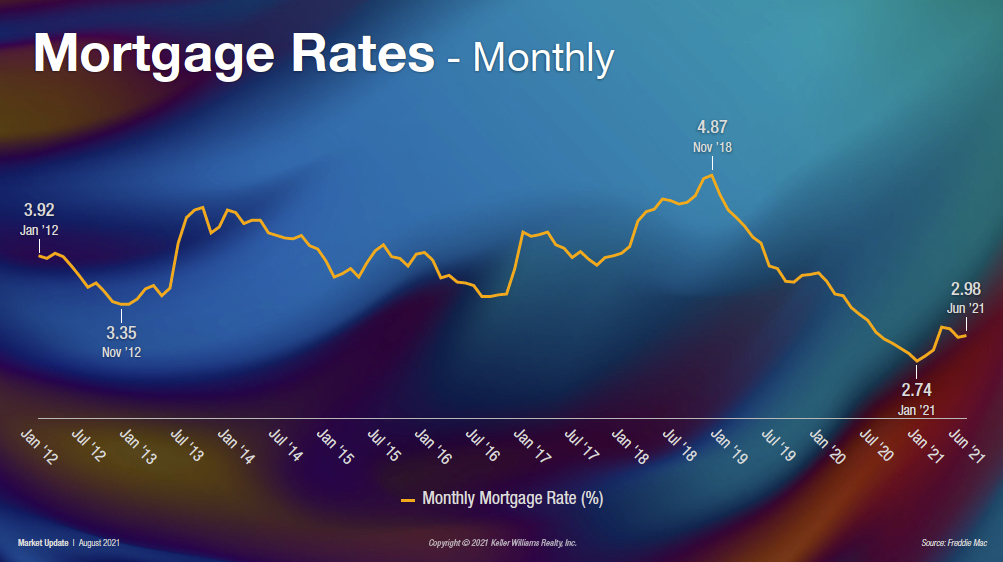
This chart says it all! Rates have never been lower…EVER! Nothing more to say. Interest rates have been trending down from 16 – 18% since 1981.
Rates have never been lower…EVER!
Our Gross Domestic Product Output
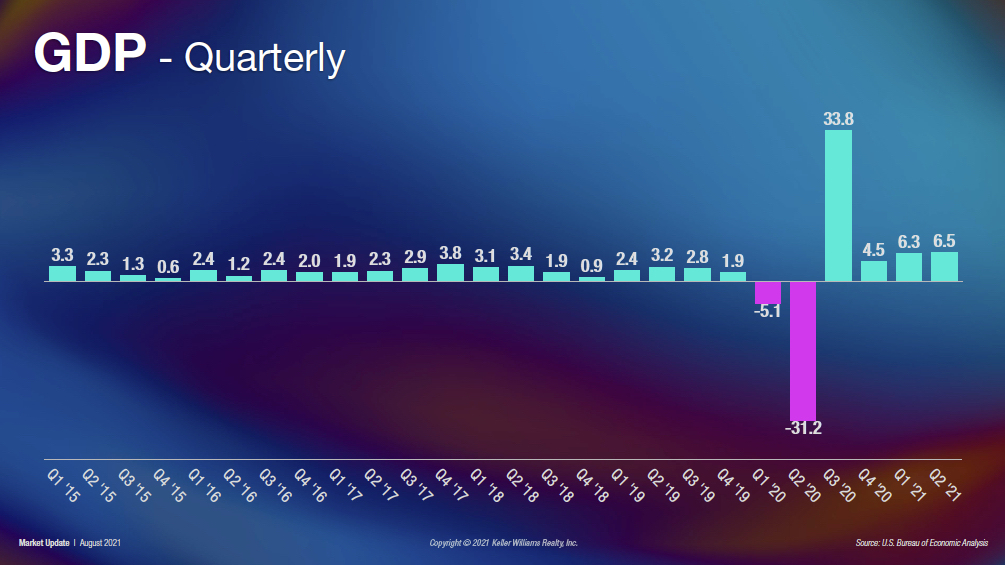
The data above comes frome the US Bureau of Economic Analysis.
The Gross Domestic Product is the value of all goods and services produced in a country during a specific period. So, without getting to technical, any number above 2% is good! In 2021 we are now at 6.5% which is a little too good!
When we look back in 2020, the Pandemic and the lock downs threw us off the cliff. However, now we are back! Currently this is a goods driven economy at this point because the service sector is still lagging. 6.5% may seem great…but inflation has been starting to show up for a couple months now. Inflation and it’s affects on what we pay for goods and services directly impacts our quality of life.
Consumer Confidence – Has Never Been This Low

So, with the economy roaring why is consumer confidence so low? And…it has never been this low! Unlike interest rates, this is not a good thing. This has been caused by the uncertainty. When people wake up each day and they are not able to predict what the world will bring, it’s uncomfortable!
So how does this impact real estate. My thoughts are that it impacts it in a big way. I believe that this is one of the driving factors for the migration we are seeing across the country. People are simply looking for a better life and making a change in where they live is the first step.
Unemployment In Check!

Another surprise area in this Fall Charleston Market Update is unemployment. After being hit hard at the beginning of the pandemic, unemployment is now projected to be at 4.8% by the end of the year. Which is a great number! The government typically like to see unemployment under 6%
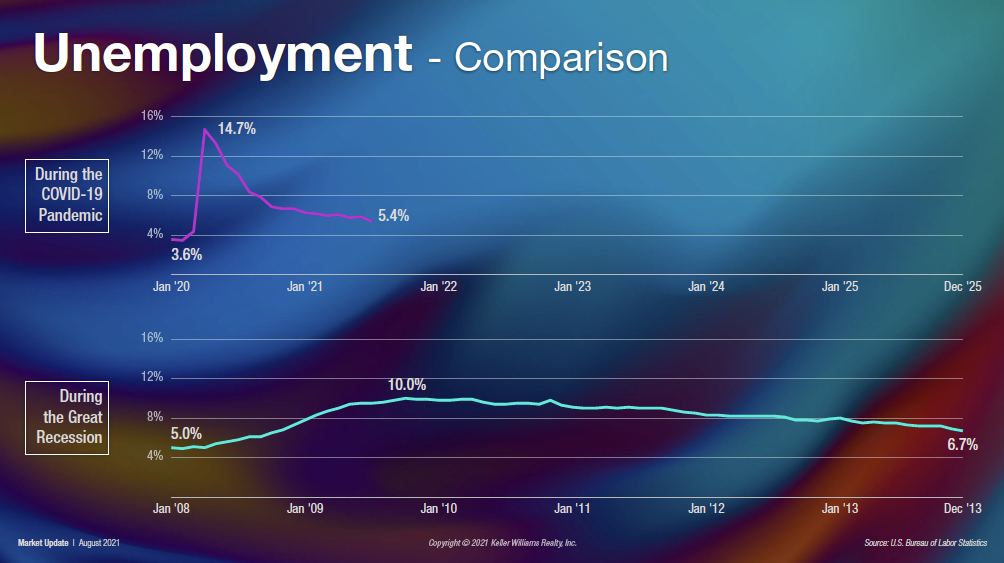
Now let’s look at the unemployment rates during the Great Recession and the current Pandemic. Here you see the speed in which the economy and employment has come back.
During the Great Recession to took us a lot longer to get us back to anywhere near 6% unemployment. And during Covid, it has only taken us 2 years to get back to under 6%. What this means is that the underlying economy going into the pandemic at the end of 2019 was extremely strong.
According to Gary Keller, this has been a health crisis that has turned into and economic crisis. The Great Recession was a pure economic crisis that took longer to unwind.
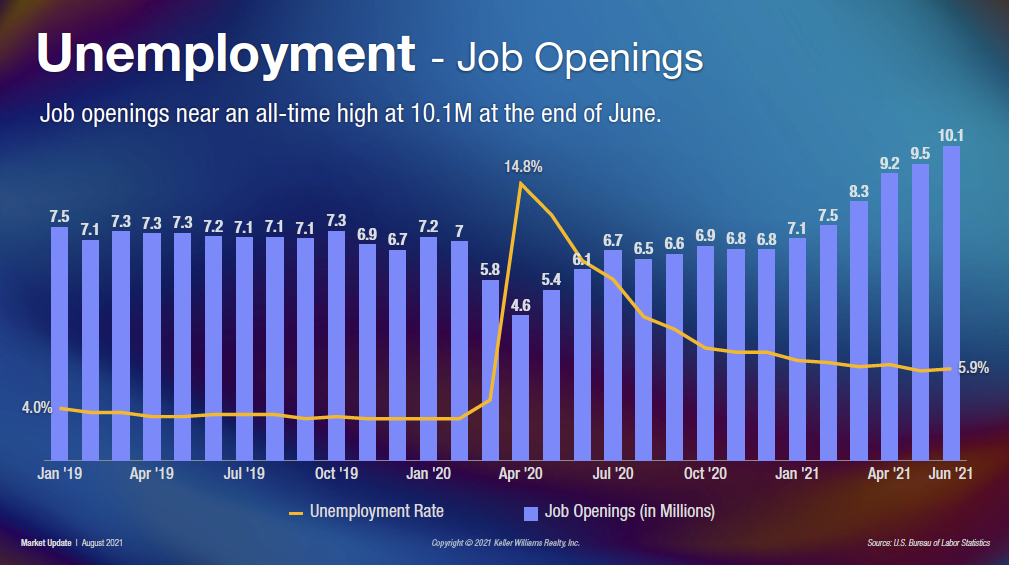
This is a very interesting chart. The yellow line shows the unemployment rate as of June. The blue bars show the number of available jobs near all-time highs. This surprised me very much! Many experts believe that this dynamic will cause wage inflation in the US. This means that income will increase in America and so will inflation!
The Dragon That Needs to Be Slain
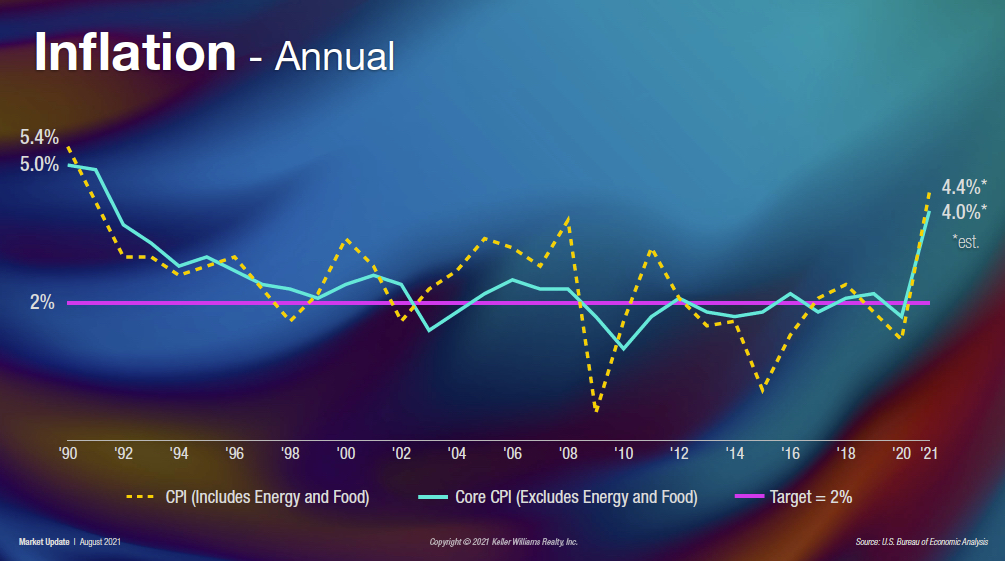
The Federal Reserve Board has for a very long time used 2% as their target rate of inflation. As this chart shows, the inflation rate is heading into territory we haven’t seen since the early 1990’s.
Everyone is feeling it. In my opinion, this has been caused by the shortages that have precipitated from the lock downs and shutdowns of our factories, mills and other businesses. In additiona, our supply chain has been handcuffed by workers that have had to stay home.
What Can Be Done?
The one tool in the governments toolbox to cool inflation is to regulate “the cost of money”! Yes, that means raising interest rates.
Fall Charleston Market Update – New Homes
New Homes Nationally
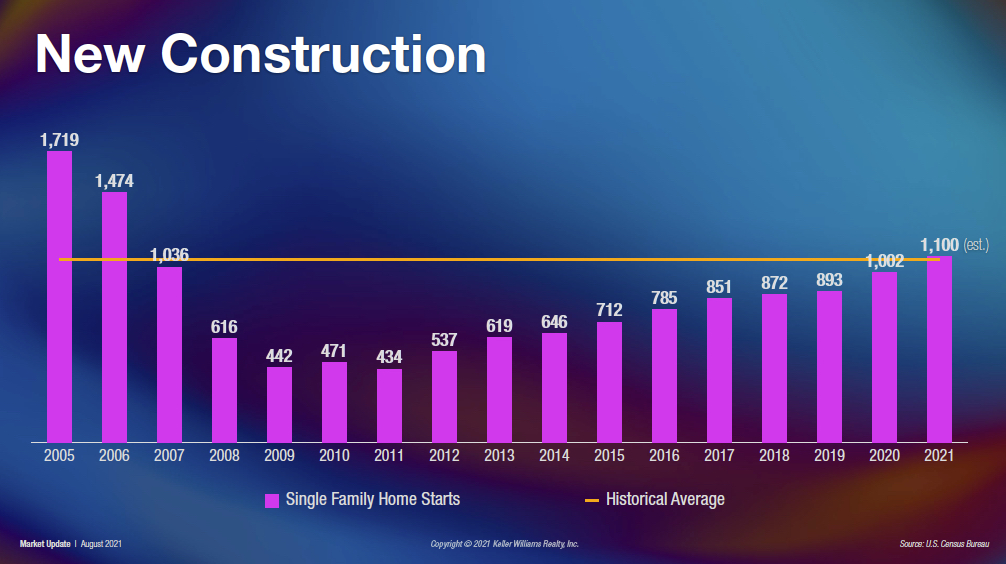
The historical average for single family home starts per year is 1 million. We are finally back up to that benchmark as builders work to keep up with demand. What’s remarkable about this, especially this year is that builders have been wrestling with a variety of headwinds.
Builders have been slowed down by local regulations, the slow approval and permitting processes and anti-growth sentiment in some areas. Additionally they have faced supply shortages, labor shortages and the rising costs of materials like lumber have all had an impact on housing.
And…the big one! Not enough developed lots to build on. Which I believe was the initial catalyst that drove prices up early in the Housing Crisis in the early 2000’s. It’s something to watch moving forward!
New Homes Locally

Local housing starts seems to mirror the national numbers. Locally builders have been selling everything they build and raising prices. This has been to offset the rising costs of construction materials and labor. However, this hasn’t discouraged home buyers, they keep on buying!
Affordability – The scary number!
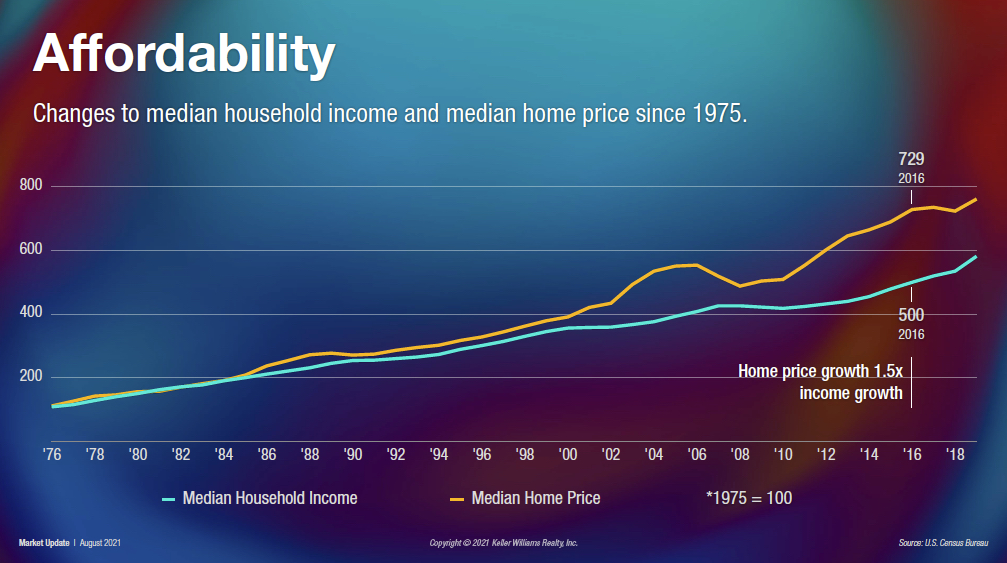
For years I have used this chart to tell the story of the Housing Crisis Bubble of the Great Recession. The Blue Line shows the Median Household Income in the US, and the Gold Line shows the Median Home Price.
The Gap Between Median Household Income and Median Home Prices Has Never Been Wider!
Up until 2001, these lines ran pretty much in “lock step” with one another. Then the run up began, and the divergence became greater and greater. Home prices became a lot higher than the Medium Income only to come back down during after the Great Recession.
Since the market bottom in 2010, we’ve been off to the races again! Now, we are seeing the greatest disparity between Household Income and the Price of a Home in recorded history.
This divergence is what forced lenders to get very creative with financing during the housing crisis. They had to find a way to bridge this affordability gap for home buyers, and unfortunately they did.
Now we are in a similar situation with the gap between income and prices having never been wider. For now, the rules put in place after the housing crisis have been very effective. The credit quality of borrowers has been kept strong and we have a higher savings rate. These are a couple of the reasons that should keep us from having another housing crisis.
Fall Charleston Market Update – A Prediction
So, what’s going on? What Gary Keller believes, is that incomes in the US have lagged and that low interest rates have bridged this affordability gap. Moving forward with an abundance of jobs available and the potential for wage expansion, higher wages could bring these lines closer together as well!
Mortgage Forbearance – Nothing Like During The Housing Crisis!
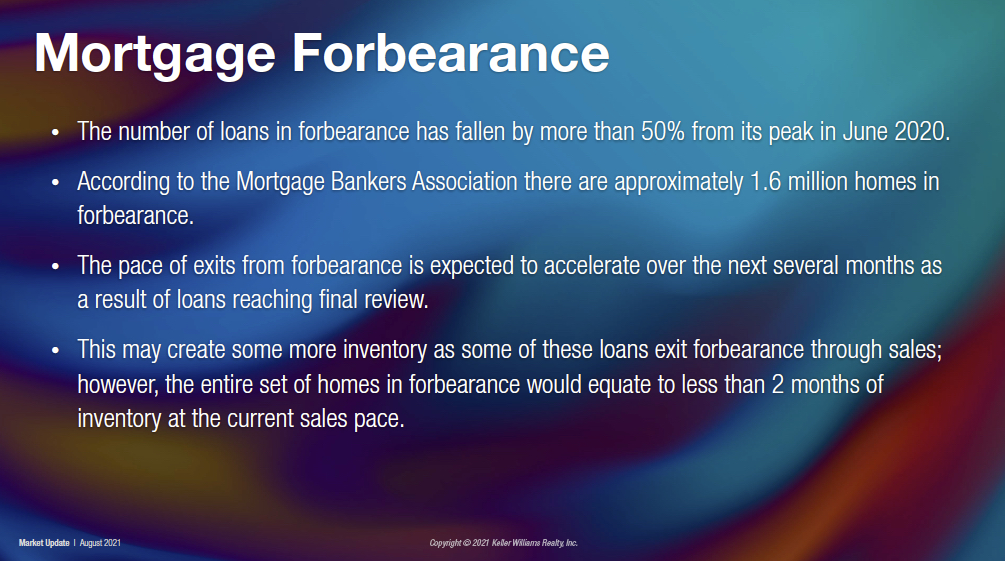
The bottonline here is that Mortgage Forbearances will not negatively effect housing. And there are many reasons. The biggest reason is below:
- These homes are not underwater. Prices have risen and people have equity in their homes.
- This gives folks options they didn’t have during the housing crisis.
An additional fear many have had is that as people exit Forbearance, it will flood the market with inventory. This simply won’t be the case, there are just not that many homes in forbearance now. The impact will be minimal.
Is Remote Work Really Driving Our Market?
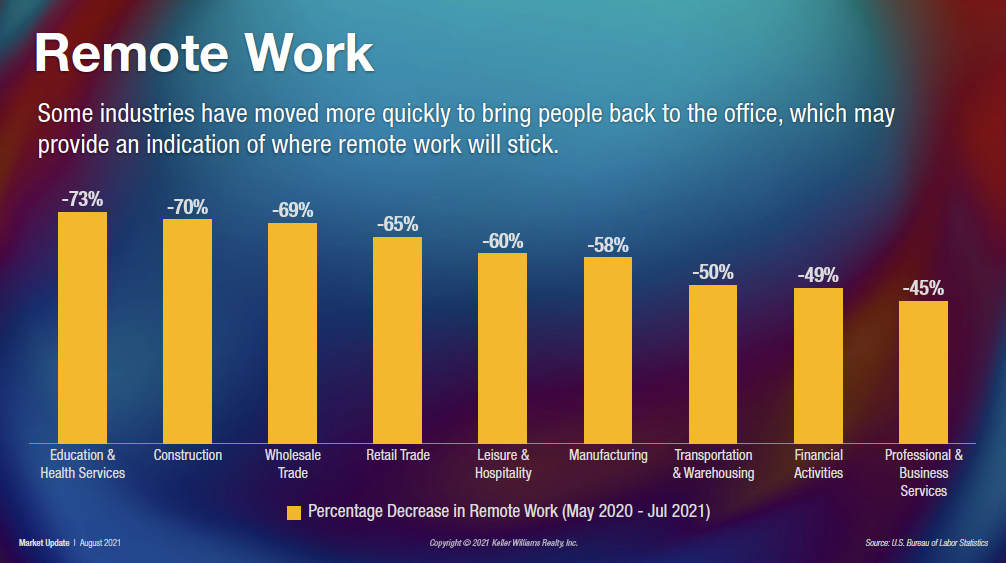
As we are working through the pandemic, we are actually seeing many folks go back to work. As we have discovered over the last few months many jobs are well suited for remote work. Yes, some people have more flexibility now and they are definitely taking advantage of this new feedom to live were they want!
Carly Tripp – “This is Not a Housing Bubble”
Nuveen Real Estate Global CIO and Head of Investments – Sept. 1, 2021
In the video from CNBA Carly outlines several reasons why she believes this is not a housing bubble! All of which makes perfect sense to me!
- Low Rates!
- Low Inventory!
- Construction Delays!
- Mortgage Debt is less than 50% of GDP vs 70% in 2007!
- Heavy Migration to the Sun Belt States!
- Young Homebuyers coming into the market!
- Home Supply will not catch up to demand for a long time!
Conclusion – Fall Charleston Market Update
Yes, I know this is a lot of information! So, let’s look at what we just went over, and the key points discussed.
- We are not having a housing shortage; we are having a housing boom!
- If Home Prices are back on the historical trend line, maybe things aren’t that out of whack?
- The inventory issue may not be solved anytime soon if the pace of demand continues.
- Low Mortgage Rates – Are helping bridge the affordability gap.
- Low Unemployment and the large number of available jobs could cause wages to rise. This would certainly help fill the gap between incomes and home prices.
- We need to pay attention to inflation.
- Mortgage Forbearance will have minimal impact on our market.
- Migration and Remote Work have been fueling demand in the Charleston Market.
- This time is not like last time”!
Based on my research, I believe we are not in a bubble. However, that doesn’t mean we don’t want to keep a watchful eye on a few key indicators.
Fall Charleston Market Update – Key Indicators to Watch
- Watch inflation, it may trigger the Fed to act to cool down the economy.
- If the Fed does act, pay close attention to what they do to slow the economy down and tame inflation.
- Watch interest rates. Raising rates is the Fed’s tool to control the money supply.
- Watch for more major international incidents or conflicts. These types of events will affect our already low consumer confidence.
- Watch for increased local regulations on housing construction and development. Attempts to slow down building and development with further limit the amount of supply of homes. This will cause prices to continue to move higher.
- Watch for banks to offer more creative financing. If wages don’t increase and rates rise, banks may develop risker financing options to bridge the gap between income prices. Which was a major catalyst for the housing crisis.
- Watch what our government does with Covid-19 protocol moving forward. Certain decisions could trigger more downward pressure on consumer confidence.
Standing At the Crossroads
We find ourselves in a challenging time! I would say we are near a crossroad in our economy. From inflation and strong demand to Covid-19, employment, wages and more, we’ve go a lot to pay attention to!
I hope you’ve enjoyed my Fall Charleston Market Update. Every time I prepare a Market Update, I discover a few things I didn’t expect to learn.
Thanks for taking the time to read this, if you’ve gotten this far, I am flattered and humbled. Cheers!

The Author…
Bill Byrd is a Husband, Father, Realtor, Educator, Musician and Athlete. A licensed Realtor since 1986 who loves helping his clients grow their personal wealth through real estate! Having helped hundred’s of families and individuals during his career you can feel comfortable that Bill’s and his Team’s experience and expertise are unparalleled in our market. Plus, Bill’s a great guy and one heck of a guitar player! More About Bill

